Summary
Drastically cutting transport greenhouse gas emissions (GHGe) is essential to meet climate targets and prevent the adverse health and other consequences of climate change. However, we need to make sure emissions reductions are fair across the population. We used the household travel survey to examine existing inequalities in household transport GHGe in Aotearoa New Zealand: this information is essential to design good policy and achieve a fair transition to a low carbon transport system. We found high levels of inequality in all modes of transport. The more affluent emitted 79% more transport GHGe weekly, mainly from the extra 97km driven each week. Flying was the most unequal mode of travel and made up 10% of weekly emissions from people who live in the least deprived quintile. Transport policy must focus on measures to reduce emissions that are effective and reduce inequities. This will require scrutiny of current policy processes, serious attention to transport disadvantage and poverty, and implementation and evaluation of fair and sustainable transport interventions.
Reducing greenhouse gas emissions from transport is essential to meet our legal targets towards net zero, our international commitments and, of course, to avert climate change. The transformation required to get to a low carbon transport system is profound and we need to do this whilst reducing the unfairness already embedded in our transport system. Tackling this inequity while reducing transport emissions is not a “nice to have” but integral to achieving the required reductions and creating public support that makes this radical change possible.1,2
Monitoring inequity is essential; we need to understand baseline inequities to highlight who is being privileged by the current system, to inform policy design and, over time, to ensure the impacts of policies are fairly distributed. Our recently published research (open access) utilised the nationally representative New Zealand Household Travel Survey to examine socioeconomic inequities in household transport greenhouse gas emissions.
What we found
Our findings are unambiguous: the more affluent a person is, the higher their emissions from household travel (i.e. personal travel for work, leisure and other reasons). It was a consistent picture. Whatever the metrics – vehicle kilometres travelled weekly, level of vehicle ownership, air travel, reasons for travel (e.g. paid work, unpaid work and leisure) – people who reside in the least deprived neighbourhoods had substantially higher emissions.
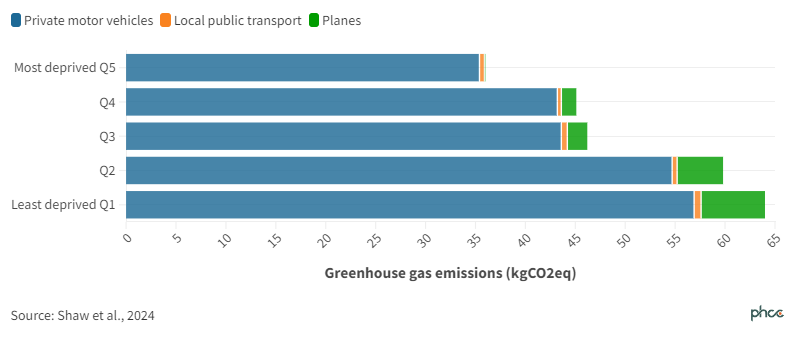
Individuals residing in the most affluent areas were responsible for about 79% more GHGe per week from household travel than those in the most deprived areas. This was primarily because the most affluent drive more, the difference was an extra 97 kilometres per week on average travelled by private vehicle.
Air travel stood out. For people living in the most affluent neighbourhoods, domestic air travel was the second-largest source of their weekly transport emissions (10%). One in 50 (2.4%) of individuals in the most affluent group reported taking a flight during the survey week, compared with one in a thousand (0.1%) of those living in the most deprived areas.
Figure 1. Per capita weekly transport emissions by mode of travel and deprivation (NZDep quintile)
Even after adjusting for age, household size, and disability status, the socioeconomic inequities persisted. People who live in the least deprived neighbourhoods in Aotearoa New Zealand (NZ) produce approximately one tonne more emissions from travel annually than those in the most deprived areas.
Overall, the top 20% of people with the highest household travel GHG emissions were responsible for around 55% of the total weekly emissions; and the bottom 60% of people (those with the lowest emissions) were responsible for only 20% of the total weekly emissions (Gini coefficient 0.54).
Implications for transport and climate policy in Aotearoa
Clearly, some groups are ‘privileged’ by the current transport system, since they drive and fly more, meaning they disproportionately harm the environment and other people’s health (e.g. through air pollution emissions). However, it is not obvious that carbon-intensive lifestyles benefit wellbeing. We found the most affluent spend almost an additional three working weeks (104 hours) in their cars annually compared to the least affluent. But others have pointed out that, over a threshold, driving time tends to be associated with poorer health and wellbeing.3,4 In general, once basic needs are met, wellbeing is not improved by increasing GHGe.5,6
In this study, people living in the most deprived areas are emitting significantly less per week from their transport. However, rather than a win for GHGe, this reflects a transport system in which many people are unable to take needed trips. For instance, many low-income households miss trips for healthcare, because of cost.7,8 And low-income households spend proportionately far more of their income on transport (16 % in 2016) compared to high-income households (9 % in 2016).7
These findings tell us that the system is not working very well for anyone. Broadly, we need to move away from car dependency, and reduce harmful consumption by the well-off. We need to create cities and towns where being able to engage meaningfully in society is not dependent on your ability to own and drive a car. This requires serious investment in policies and infrastructure to boost public transport, walking, cycling, and dense urban form; we know these are effective approaches.9 Interventions to reduce transport GHGe in the highest emitters might include: parking pricing based on vehicle size, frequent flyer levies, and bans on advertising high carbon products (including air travel). At present, we lack transport-specific evidence about approaches targeting high emitters. However much has been written about the theory and practice of effective population-level behaviour change that is relevant to transport.10,11
We have noted already that flying was the most unequal mode of travel. New Zealand’s First Emission Reductions Plan assumes that technological innovation will fix aviation emissions;12 but some argue this assumption is not secure.13 Our research suggests that demand management would be a reasonable way of reducing air travel emissions due to the level of inequity in who is flying.
Conclusion
We find large social gradients in transport-related GHGe in NZ, and these speak to unfairness at the heart of the current, car-dependent, system. It is essential that while we move to a low-carbon transport system, we also aim to reduce current inequities and avoid creating new ones. Significant work on policy processes, design and evaluation is required to facilitate this dual transformation.
What this Briefing adds
- People who live in the least deprived areas of NZ emit 79% more transport GHGe weekly than those in the most deprived areas.
- People who live in the least deprived areas of NZ drive 97 km more each week.
- Air travel is the most inequitable mode of transport and represents about 10% of weekly emissions of people who live in the least deprived quintile.
- The top 20% of emitters are responsible for around 55% of the total weekly emissions.
- Inequity is embedded in the current transport system.
Implications for policy and practice
- Greenhouse gas emissions are a determinant of population and planetary health
- Inequities in transport GHGe emissions need to be managed as part of an effective and just transition
- The health sector has an interest in reducing transport emissions while creating a healthier transport system
- Lessons from decades of public health behaviour change policy as well as policy and practice on reducing inequities are relevant to the transport sector.
Author details
Assoc Prof Caroline Shaw, Department of Public Health, University of Otago Wellington
Prof Alistair Woodward, School of Population Health, University of Auckland
Additional information
This Briefing summarises a publication undertaken by a wider research team:
- Associate Professor Caroline Shaw, Department of Public Health, University of Otago Wellington
- Ryan Gage, Department of Public Health, University of Otago Wellington
- Associate Professor Melissa McLeod, Department of Public Health, University of Otago Wellington
- Associate Professor Rhys Jones, Te Kupenga Hauora Māori, University of Auckland
- Dr Anja Mizdrak, Department of Public Health, University of Otago Wellington
- Professor Alistair Woodward, School of Population Health, University of Auckland
This work was supported by the New Zealand Health Research Council [grant number 20/151].
Thanks to James Stanley and Ryan Gage for additional statistical support in calculating the Gini coefficient for this Briefing.