Summary
Leaking water system infrastructure in Aotearoa New Zealand (NZ) poses risks to public health and wastes precious public funds—estimated at around $122 million per year. In this Briefing, we estimate NZ’s national leakage level, finding that 22% of water is lost through leaks in water systems. This is far worse than leading European countries such as the Netherlands (5%) and Germany (6%). A more sophisticated metric (the Infrastructure Leakage Index), also suggests NZ is ranked near the bottom of a list of 15 jurisdictional groupings with data (the median index score for NZ is 2.7 compared to 0.7 for Denmark).
While there has been some recent progress, such as intensified work on leak repairs and water metering, additional central and local government investment is needed to upgrade critically important water system infrastructure.
In a previous Briefing we detailed how leaking water infrastructure in NZ poses risks to public health (see Box A1 in the Appendix).1 This leakage also wastes precious public funds, estimated at a loss of around $122 million per year.1
In this Briefing, we explore country comparisons around water leakage – as this perspective may provide insights into what is possible for NZ to achieve.
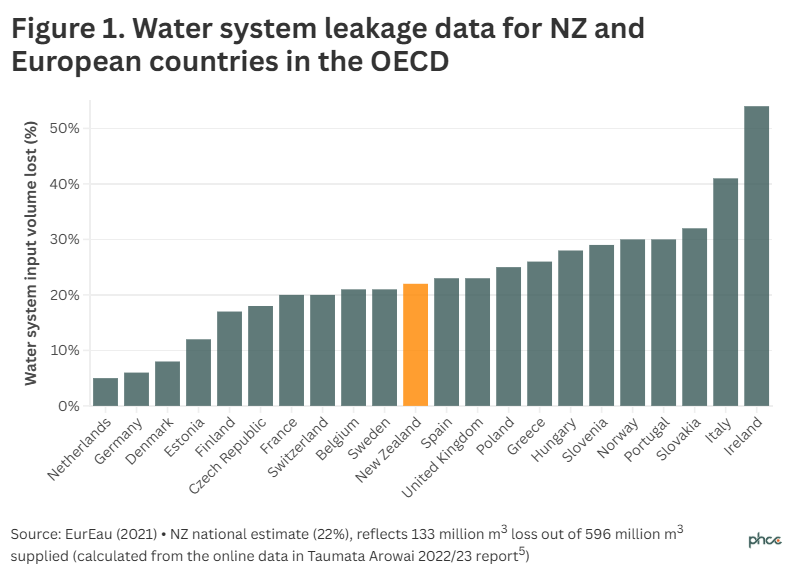
Using data from the national water regulator (Taumata Arowai), we estimated a national leakage level of 22% (133 million cubic metres (m3) lost out of 596 million m3 supplied for 332 water providers and when excluding anomalous data). This estimate has various limitations (see Appendix), but is similar to a previous “nearly 20%” leakage estimate from Water New Zealand in the fiscal year 2022.2 The figure for just the larger suppliers providing water to 1000+ residences in NZ (n=103), was also similar at 21%.
Figure 1 gives water leakage results for OECD countries in Europe along with NZ. It shows that NZ performs better than the median country in this group, but is still far worse than the Netherlands (5%) and Germany (6%). Also, the NZ national 22% estimate obscures some particularly poor locality results eg, Upper Hutt at 41% leakage,3 and South Wairarapa at 42%.4
But using leakage data based on the percentage of water system input volume lost as in Figure 1 is fairly crude. That is because this measure is “influenced by consumption and does not take into account the factors of supply continuity, mains length, number of service connections, location of customer meters, and average operating pressure”.5 A more appropriate metric is the “Infrastructure Leakage Index” (ILI) with OECD jurisdiction comparisons shown in Figure 2 (Table A2 in the Appendix). These comparisons suggest that NZ is a relatively poor performer (median ILI of 2.7 for the largest water suppliers), and it is ranked near the bottom of a list of 15 jurisdictional groupings with ILI data. For example, the ILI for the Netherlands is 0.6 and for Denmark it is 0.7 (Table A2). Furthermore, the “Wellington Water network reported the highest ILI of urban networks at a value of 5.2.”6 These figures are consistent with Taumata Arowai documenting many pipelines that are in “poor or very poor condition”.6
| Box: A historical diversion – leakage from aqueducts supplying Ancient Rome |
|---|
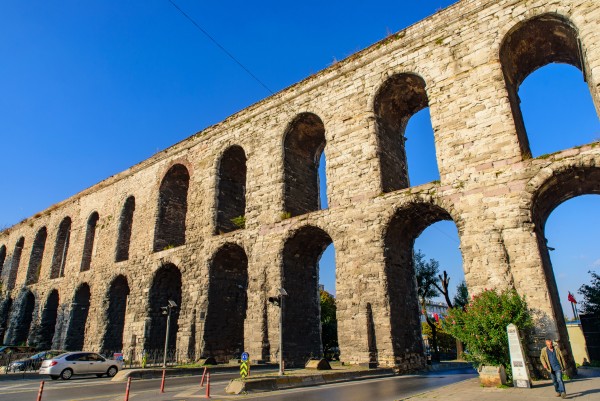
| Water supply engineering in Ancient Rome was particularly impressive,7 and so we considered the issue of leakage rates from Roman aqueducts for potential historical comparison purposes. While no published estimates were identified, there are relevant measurements from four aqueducts that supplied Rome. Using these measurements would very roughly suggest overall leakage of 47% (range 11% to 68% for the four aqueducts, see Appendix). But these are probably over-estimates given the lack of data on the constructed diversions of water to towns on-route to Rome (as discussed elsewhere:8). Perhaps of most relevance to the modern day is that Roman aqueducts were typically extremely resilient, with one lasting for over 1300 years (the Valens Aqueduct in Constantinople/Istanbul – albeit with ongoing maintenance and repairs). Furthermore, these systems were built to ensure easy maintenance and were entirely gravity-powered, unlike modern-day systems often requiring electrically powered pumps. One Roman aqueduct in Athens (Greece) has been described as “Europe’s longest functional underground aqueduct” and it is currently being upgraded to supply non-potable water to the city.9 |
The good news about identifying and fixing leaks in NZ
Fortunately, there is increased activity in fixing leaks in parts of the country, with Wellington Water fixing nearly 4000 leaks during 2024 (as reported in November10; albeit with trivial investment in replacing aging pipes11). There is also growing appreciation of the value of water metering in assisting in detecting major leaks and saving costs12 (eg, a New Plymouth example13). Survey data indicates that most (72%) of NZ respondents felt it was fair to pay for water,14 and there are ways to address equity with a basic free allocation.1
A particularly impressive low leakage result was achieved by the former Waitakere City Council (now part of Auckland Council). Through a number of initiatives and management practices over an 18-year period, it “achieved and maintained an Infrastructure Leakage Index of close to 1.0”.15 This is nearly as good as that for the Netherlands and Denmark (Table A2).
New technologies such as devices that travel through water pipes with acoustic sensors and GPS connectivity are reported to be helping detect leaks overseas.16 There are also new acoustic tools that operate from outside of pipes and use artificial intelligence to pinpoint leaks.16
While improving water infrastructure and fixing leaks can ultimately save costs, local government in NZ still needs more upfront revenue for investing in water infrastructure. So there is a need to fix what NZ mayors have described as a “broken” funding model for local government.17 That is Central Government needs to directly contribute more resources to local government infrastructure – or make other changes to improve local government financing. The latter could include giving back to local government a proportion of locally-raised GST,18 charging rates on government facilities, and allowing local government to raise revenue from local fuel taxes.17 Ensuring the success of “Local Water Done Well” (the Government’s water infrastructure policy that replaces the previous “Three Waters reforms”), with regular reviews of how it is working, is also critical.
What’s new in this Briefing
- NZ’s national water system leakage level is estimated at 22%, which is far worse than leading European countries eg, the Netherlands (5%) and Germany (6%). This leakage wastes money and can cause additional infrastructure damage.
- More sophisticated metrics (Infrastructure Leakage Index) also suggests NZ is a poor performer, ranked near the bottom of a list of 15 OECD jurisdictional groupings with data. This is consistent with many pipelines described as being in “poor or very poor condition”.
- Nevertheless, there is some ongoing progress in addressing leakage in NZ, including use of water metering.
Implications for public policy and practice
- Central government needs to consider improving the broken funding model for local government – so that the latter is better placed to invest in water system infrastructure.
- Local government needs to continue to upgrade water infrastructure and explore all the proven and cost-effective tools available (eg, water metering and new technologies for detecting leaks).
- Citizens could elect central and local government politicians who have a long-term perspective and who support building resiliency into all infrastructure that is fundamental to health and wellbeing.
Authors details
Prof Nick Wilson, Adele Broadbent, Dr John Kerr, and Prof Michael Baker are all based at the Public Health Communication Centre and Department of Public Health, University of Otago, Wellington.
APPENDIX: Additional Details
The health and other problems from aging water system infrastructure and leaks
| Box A1: Brief summary of the various health and other problems arising from aging water system infrastructure and leaks (for additional details see: 1) |
|---|
- Water contamination: When a water system leaks, it can create a pathway for contaminants to enter the system and cause waterborne disease outbreaks (as reviewed for the US setting19).
|
- Water loss: The most obvious problem is the loss of water, which can be particularly critical at times of scarcity, often the summer months in various NZ localities. At such times, citizens may be forced to go out of their way to save water and spend money on storage tanks and purchase of additional water.
|
- Economic cost: Water treatment and distribution involve significant costs – and so leakage is a cost to Councils and rate payers.
|
- Infrastructure damage: Continuous leakage can potentially undermine the structural integrity of the water distribution infrastructure eg, via soil erosion around pipes, destabilising them, and resulting in more significant and costly damages. It can also lead to slips (eg, with an example of such a slip in NZ in 202320).
|
- Trust and credibility impacts: The inability of Councils to maintain efficient water systems may add to public mistrust in the overall quality and safety of these systems – driving some people to use water filters or buy bottled water.
|
- Additional problems after natural hazard events: Aging pipes are more likely to be damaged in earthquakes or storm/flood events. This can compound such crises and further increase recovery times and costs. See for example all the water infrastructure failures following Cyclone Gabrielle in 2023.21
|
A historical diversion – estimating leakage from Roman aqueducts
As discussed above, we did not identify published estimates of leakage rates for aqueducts in Ancient Rome. Nevertheless, measurements by Blackman8 have been used in the table below.
Table A1: Estimates of leakage from four aqueducts supplying Ancient Rome
| Aqueducts supplying water to Rome (with measurement data) [length] | When built | Mean width (m) of the channel (specus)* [A] | Water height (m) at start** [B] | Water height (m) at end** [C] | Estimated transection area (m2) at start [D]=[A] x [B] | Estimated transection area (m2) at start [E]=[A] x [C] | Percentage reduction reflecting water loss (100% - [E]/[D])*** |
|---|
| Aqua Anno Vetus [64 km] | 272-269 BCE | 0.9 | 1.7 | 0.9 | 1.53 | 0.81 | 47% |
Aqua Marcia [91 km] | 144-140 BCE | 1.0 | 1.5 | 0.6 | 1.50 | 0.60 | 60% |
Aqua Claudia [69 km] | 52 CE | 1.1 | 0.9 | 0.8 | 0.99 | 0.88 | 11% |
| Aqua Anio Novus [87 km] | 52 CE | 1.2 | 3.1 | 1.0 | 3.72 | 1.20 | 68% |
| | | | | | | | 47% (average) |
* Estimated from figures in Blackman.8
** Water height in the channel (specus) at the start and end of the aqueduct were estimated from figures in Blackman8 with the water level being indicated by horizontal marks on the channel (from deposits due to the highly mineralised water7).
*** This simplistic approach ignores variation in width, slope, variation in the surface of the channel, and takes no account of the diversions of water to towns on-route to Rome. The latter would suggest that actual water loss would probably be less than the estimates obtained in this analysis.
Water system leakage data using the Infrastructure Leakage Index
Table A2: Water system leakage data using the Infrastructure Leakage Index (ILI) for OECD jurisdictions that have provided data to the International Water Association (IWA)22 (for variable periods spanning 2007 to 2015 unless otherwise stated)
| OECD jurisdiction | Number of utilities in the sample | Median ILI | % of sample utilities with an ILI of ≥2.0 | Comment/ reference |
| ILI <1.5 is defined as “very low” “leakage performance category” (LPC) by the IWA |
| Netherlands | 10 | 0.6 | 0% | |
| Denmark | 37 | 0.7 | 3% | |
| Belgium (Flanders) | 7 | 1.0 | 14% | |
| Germany | 44 | 1.0 | 25% | |
| Austria | 50 | 1.0 | 36% | |
| Australia | 65 | 1.1 | 21% | |
| ILI ≥1.5 and <2.0 is defined as being a “low” LPC |
| England/Wales | 9 | 1.7 | 22% | |
| ILI ≥2.0 to <4 is defined as being a “moderate” LPC |
| US – California (large utilities) | 254 | 2.3 | NA | 2018 data, source: 23 |
| Portugal | 14 | 2.6 | 67% | |
| Canada | 33 | 2.7 | 67% | |
| NZ (largest providers & excluding n=11 anomalous results) | 96 | 2.7 | 73% | Providers with at least 1000 residential connections and probably the most reliable national estimate for NZ. Source:* |
| NZ (all providers except excluding n=12 anomalous results) | 287 | 2.8 | 69% | Source:* |
| US – Georgia (large utilities) | 94 | 3.3 | NA | 2018 data, source: 23 |
| ILI ≥4.0 to <8 is defined as being a “high” LPC |
| Croatia | 23 | 4.5 | 80% | |
* NZ data from the water regulator Taumata Arowai for 2022/23, with our calculations from the online dataset (with exclusion of anomalous results with either zero supply recorded or where the loss was ≥100% of the water supplied).6 Another indication of suboptimal data quality of these water supplies is that only 52 water providers had any of their piping network with any condition grading.


