Summary
Earth overshoot day marks the date when human resource consumption surpasses the capacity of ecosystems to regenerate. Globally this date is projected to fall on 30 July, showing we would need around 1.8 Earths to sustain current patterns of consumption in the long term. Aotearoa New Zealand's overshoot day for 2025 is 30 April, highlighting widespread unsustainable practices, especially compared to a country like Uruguay, whose overshoot day is 17 December.
While overshoot day is a vivid communication tool, it simplifies complex systems and doesn't fully capture issues like biodiversity loss and pollution other than that from carbon (CO2). Despite its limitations, the concept of overshoot is useful for raising awareness and guiding policy towards more ecologically sustainable and health promoting practices. Central and Local Government could advance a range of policies to minimize unsustainable resource use in NZ , including: those promoting renewable energy sources, sustainable transport, regenerative agriculture, and supporting predominantly plant-based diets. All of these measures have important co-benefits for population health.
This Briefing explains the concepts behind Earth Overshoot Day (EOD) and its value in raising awareness about how we can achieve a more ecologically sustainable society which also supports improved public health.
What is Earth Overshoot Day and what does it mean?
EOD is based on Ecological Footprint accounting which quantifies the supply of and demand for Earth’s biocapacity.1 The EOD is the date when humanity's demand for ecological resources and services each year exceeds what Earth can regenerate in that year. From this day forward, we are depleting natural capital, leading to resource deficits and environmental degradation.
Ecological footprinting provides a clear, relatable measure of humanity’s ecological impact by tracking resource consumption against Earth's regenerative capacity, but it simplifies complex ecological interactions and omits key factors such as biodiversity loss (see the Appendix for more details on the strengths and weaknesses of EOD).
The Global Footprint Network calculates EOD by comparing two key metrics:
- Biocapacity: The capacity of ecosystems to generate resources to meet human demands and recover from human impacts.
- Ecological Footprint: The amount of biologically productive land and sea area required to supply the resources a population consumes and to assimilate associated waste, including carbon emissions.
Here’s the calculation:
Day 211 is 30 July, though the exact date for 2025 will be revised with updated input data later in the year. This timing indicates that humanity used up Earth's annual flow of resources in just seven months and we would need around 1.8 Earths to support us for a full year at that rate (see Global Footprint Network scenario tool to visualise future overshoot scenarios).
How does NZ compare with other countries?
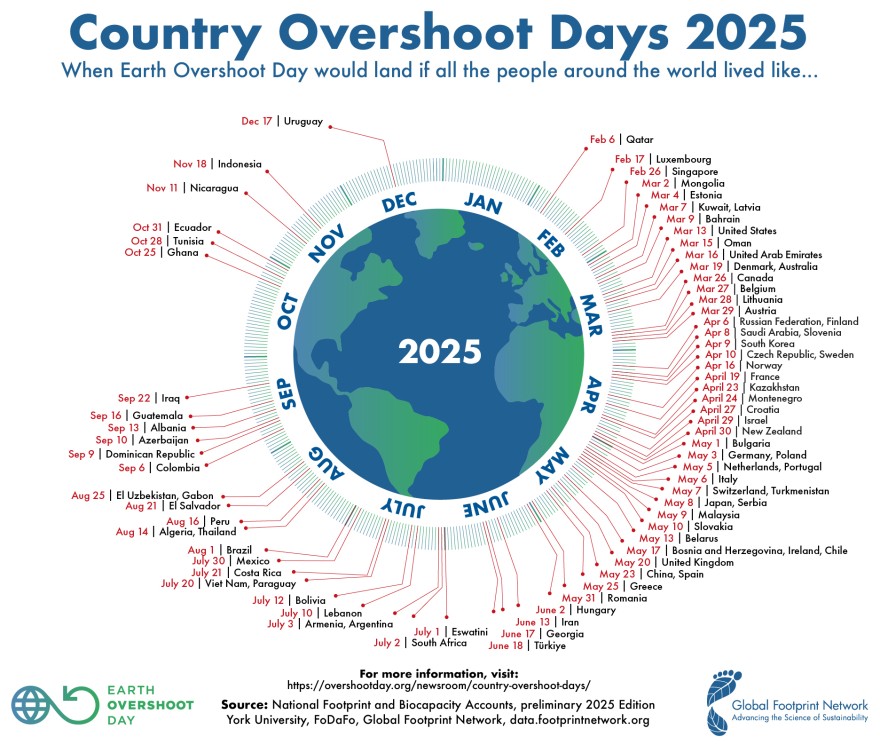
Country Overshoot Days represent the date when overshoot would occur if the global population consumed like the average resident of that country (see Figure).
That estimated country overshoot day for Aotearoa New Zealand (NZ) is 30 April. Put another way, we would need at least two more planet Earths if the global population consumed the way NZ currently does. Towards the other end of the spectrum is Uruguay with an overshoot day of 17 December, indicating its footprint is close to sustainable in global terms.
The variation in overshoot dates among countries is primarily due to differences in consumption patterns. Countries with higher consumption rates, like NZ, reach their overshoot dates earlier. Countries with more sustainable policies and lower ecological footprints, like Uruguay, have later overshoot dates. Factors influencing these differences include policies on energy, transportation, and land use.
Figure 1. Country overshoot days infographic
This preliminary 2025 edition will be updated during the year as more recent input data are incorporated. More than 50 countries have data indicating no overshoot and are not shown on this infographic.
Can NZ act more like Uruguay?
Uruguay is not a perfect comparison for NZ, but it does have several similar features. It is a politically stable democracy, with a small population (3.4 million people), an economy with substantial agricultural exports, and high use of renewable electricity. Both are high-income countries, Uruguay with per capita GDP of US$22,800 in 2023 and NZ at US$48,280 (classified according to the World Bank).
A detailed comparison of why Uruguay performs so well relative to NZ in terms of ecological footprint is beyond the scope of this Briefing. Factors reported as supporting its low footprint include a combination of very high renewable electricity adoption, sustainable agricultural practices, compact cities with a focus on public transport and cycling, proactive environmental policies, and a commitment to transparency.
There are several major policy directions that both Central and Local Government in NZ can accelerate to reduce our ecological footprint and move this country’s overshoot date to later in the year:
- Ensuring a supportive policy environment: Building environmental sustainability into the policy making process at all levels, including an emphasis on sustainable resource management, environmental conservation and reduced greenhouse gas emissions.
- Greater energy efficiency and switch to renewables: Building on NZ’s strong renewable energy base for its electricity system by transitioning more rapidly to renewable energy sources and improved energy efficiency in transportation, industries, and buildings.2
- More sustainable transport: Accelerating investment in public and active transport along with policies to promote more compact cities to reduce car dependency.3 4
- More sustainable agriculture: Promoting sustainable farming practices, regenerative agriculture, native reforestation, and local food systems that reduce waste and environmental impacts and improve food resilience.
- Creating a supportive environment for more sustainable consumption levels: Using regulatory tools and education to support reduced consumption, recycling, and move sustainable living patterns among citizens and whanau/families, including a shift to healthier plant-based diets and use of public transport, cycling, and walking.5
By implementing these measures, NZ can reduce its ecological footprint and align more closely with countries that have later overshoot dates. Increasing evidence shows that improving sustainability also supports population health and economic co-benefits. 6-12
What this Briefing adds
- Earth Overshoot Day reflects the estiamted date each year when humanity has used up all the natural resource flows that Earth can regenerate in a year. From this day onwards, we are living on ecological credit, depleting the planet’s natural capital faster than it can recover. For 2025 is estimated to fall on 30 July.
- NZ's country overshoot day in 2025 is estimated to be 30 April, putting us in the mid-range for high-income countries.
- There are more sustainable policy mixes, even for high-income countries. Uruguay’s overshoot day is 17 December which means it is close to living within Earth’s means. NZ could investigate policies and practices used by Uruguay to see if some could be adopted here.
Implications for policy and practice
NZ could make active policy choices now to reduce its ecological footprint, many of which would also support improved public health and potentially economic efficiency, notably:
- Reboot our clean energy transition with more investments in renewable energy to reduce our carbon footprint and lower the costs of importing fuels.
- Accelerate a currently slow transition to more sustainable transport, particularly public and active transport, supported with more compact and walkable cities.
- Shift to more sustainable farming methods, preserving soil health and biodiversity while avoiding high-emission industrial practices.
- Creating a supportive environment for more sustainable consumption patterns by citizens and whanau/families, including a shift to healthier plant-based diets and use of public transport, cycling, and walking
Author details
Prof Michael Baker, Director, Public Health Communication Centre, and Department of Public Health, Ōtākou Whakaihu Waka, Pōneke - University of Otago, Wellington
Dr John Kerr, Science Lead, Public Health Communication Centre, and Department of Public Health, Ōtākou Whakaihu Waka, Pōneke - University of Otago, Wellington
Prof Simon Hales, Co-Director, Public Health Communication Centre, and Department of Public Health, Ōtākou Whakaihu Waka, Pōneke - University of Otago, Wellington
Prof Ralph Chapman, School of Geography, Environment and Earth Sciences, Victoria University of Wellington - Te Herenga Waka
Appendix: What are the strengths and weaknesses of Earth Overshoot Day as a concept?
Ecological footprinting has been used for more than 30 years and has become one of the world’s best-known metrics of the (un)sustainability of how humanity currently lives.13 It incorporates the Carbon Footprint, which measures greenhouse gas emissions. EOD is essentially a calendar version of the Ecological Footprint.
Strengths of EOD are that it provides a clear and relatable metric to understand humanity's ecological impact. It allows comparisons over time and between countries, highlighting areas for improvement, and can influence policy decisions by emphasising the urgency of sustainable practices.14
It has several weaknesses and limitations. EOD has some degree of oversimplification as it combines interactions between complex ecological and economic system performances into one footprint indicator which is then presented as a date. It relies on available data, which do not capture all aspects of ecological consumption and regeneration. For example, it ignores biodiversity loss and pollution beyond CO₂. If anything, it understates human activity’s total impact. There are also methodological critiques that the footprint is a poor measure of ecological sustainability and offers limited guidance for policymakers in identifying options to improve management of natural capital.15 The EOD developers have responded to these critiques.16
There is a range of other tools for measuring sustainability at a global and country level, that are likely to provide more specific inputs on sustainability policy questions. These measures include Earth system boundaries17 18 and Sustainable Development Goals.