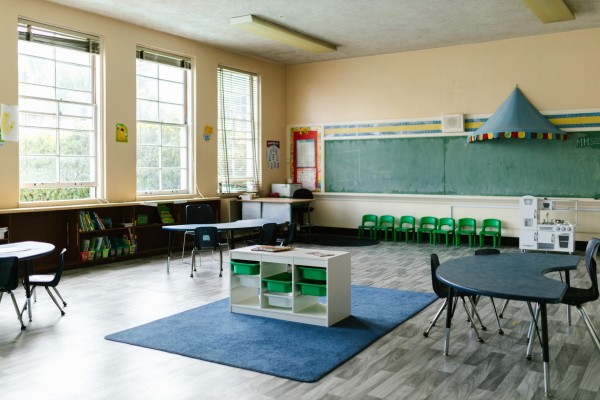
Ventilation is a key and relatively underutilised public health measure that can reduce the risk of Covid-19 transmission. Last year we outlined the need for adequate ventilation in schools and highlighted the need for nationwide ventilation surveillance. In this blog we provide an overview of the results of carbon dioxide (CO2) monitoring carried out in a variety of schools at the start of the Omicron wave. These results highlight that excessive levels of CO2 can build up in classrooms – and that this can be prevented by window opening.
Introduction
Schools are a primary setting for Covid-19 transmission. At 25 February 2022, more than 717 schools and early childhood education centres across Aotearoa New Zealand (NZ) were dealing with active cases. Since August 2021, people under the age of 19 have comprised 35% of cases and 12% of hospitalisations in NZ. Worldwide the Omicron variant is causing explosive Covid-19 outbreaks with cases in children increasing exponentially,1 2 leading to large numbers of child hospitalisations, including ICU admissions.3 There are also growing concerns about long-term effects of Covid-19 illness on children, including impacts on the developing brain.4 5
Ventilation and Covid-19 transmission
Ventilation is a key public health measure for the Covid-19 pandemic, and simply means the replacement of contaminated air with clean air. Poor ventilation in indoor settings is a key risk factor for the airborne transmission of Covid-19. Virus-laden aerosols can remain airborne, and build up, for hours in indoor spaces with low levels of ventilation.6 Ventilation reduces the number of virus particles available to infect a person. In addition to ventilation, masks decrease the number of virus particles that pass through to an individual to potentially infect them. Both public health measures are important and their effectiveness have been shown to be multiplicative.7 Thus, while mask use is important, without sufficient ventilation students still face higher relative risk of being infected.
Carbon dioxide (CO2) levels and ventilation guidelines
One reliable method of measuring ventilation is to use a monitor to measure levels of carbon dioxide (CO2). When people breathe indoors they exhale CO2 and the level of CO2 in the room will rise. In a poorly ventilated room CO2 will linger for longer, building up to higher levels.
Multiple international agencies have provided ventilation guideline values to reduce the probability of Covid-19 transmission. For example, the US Centers for Disease Control (CDC) and the UK Government Health and Safety Executive (HSE) recommend a CO2 guideline value of 800 part per million (ppm) as representative of the upper limit of good ventilation. These guidelines suggest adequate ventilation occurs at twice the atmospheric levels of CO2 ~412 ppm, representing an excess of around 400ppm CO2. A doubling in the excess CO2 translates into a doubling of the absolute risk of Covid-19 infection (note the absolute risk can be also decreased by mask use, vaccination and activity selection).7
In Aotearoa, there is currently no regulatory guideline for ventilation of existing buildings. The Building Code, which applies to new buildings states that spaces in buildings are to provide adequate ventilation consistent with their maximum occupancy and intended use. The Ministry for Education (MoE) have Indoor Air Quality and Thermal Comfort Guidelines, which apply to new school buildings and more recent guidance recommends CO2 levels below 800ppm.
What is the current ventilation situation in NZ schools?
Our preliminary study in four schools across the first two weeks of term one 2022 demonstrate that there can be quite large variations in CO2 levels depending on the activity, class size, weather, and physical classroom structure. Figure 1 demonstrates CO2 levels from two primary school classrooms (at the same school) of roughly equal size and occupancy. Across the school day classroom one had CO2 levels that repeatedly exceeded the recommended 800ppm, while the other classroom never reached the 800pm benchmark. The differences were mainly attributable to behavioural differences of windows being opened.
Figure 1. School 1 – CO2 levels in two primary school classrooms at the same school (with one regularly exceeding the 800ppm recommended maximal level)
Figure 2a shows the results of CO2 monitoring carried out at an intermediate school. Monitoring took place across a three-day period in the same classroom. The classroom was large, containing approximately 60 children and two teachers. Two of the days the windows were open and levels remained well below 800ppm. On the third day CO2 levels quickly climbed to 1500ppm and then dropped dramatically once the windows were opened. Figure 2a shows the results of CO2 monitoring carried out in a single cell classroom across a five-day period at a high school. Results again highlight the importance of opening windows, with two of the five days able to achieve adequate ventilation and two of the five days exceeding 800ppm. One of the days reached CO2 levels in excess of 2500ppm throughout the school day (over three times the recommended maximal level).
Figure 2a. School 2 – CO2 monitoring in a large classroom at an intermediate school over three days
Figure 2b. School 3 – CO2 monitoring at a single cell classroom at a high school over five days
Figure 3 shows combined CO2 levels over four days taken in a high school gym with all windows fully opened during physical education classes for students. The CO2 levels remained well under 800ppm and there were no significant differences by the intensity of the physical activity (mean CO2 levels per physical intensity level; low=573ppm, moderate=590ppm, high=561ppm).
Figure 3. School 4 – CO2 levels from indoor physical education classes in a high school gym by activity intensity. Boxes represent the interquartile range (IQR) of CO2 values for each activity type (the 25th and 75th percentile). Lines within boxes represent the median CO2 value for each activity type. Overall, the figure shows relatively low variation in CO2 levels by activity type.
Conclusions
Findings from this preliminary study show that classrooms (and gyms) in a small sample of NZ schools in summer conditions can achieve good ventilation by opening windows. Having CO2 monitors in each learning space to encourage teachers and students to take preventive action before levels exceed 800ppm is a key public health measure to protect students and teachers in school settings against Covid-19 infection, other respiratory infections and to improve student cognitive performance while learning. To reduce burden on individual schools the collection and interpretation of CO2 data requires analyst and policy support. Such support will help reduce potential inequities created by better resourced schools being able to more effectively present CO2 data and advocate for the limited air purification resources available than less well-resourced schools.
Schools are only one indoor environment and to ensure good ventilation occurs across all indoor environments NZ needs a new national agency, with multiple stakeholders that is legally responsible for ensuring improved indoor air quality. This new agency could be more sustainable if embedded within an existing national agency such as the Ministry of Health (or the proposed Public Health Agency), or WorkSafe NZ. Such an agency should introduce national ventilation guidelines for all public indoor settings based on health related and performance outcomes and assist with resourcing upgrades.
* Author details: TC, JB are in the Department of Public Health, University of Otago, Wellington. CS is in the Department of Medicine, University of Otago, Wellington.


