Summary
Many communities across Canterbury are facing increasingly difficult decisions as nitrate pollution of drinking water sources worsens. Some water supplies in the region have already breached drinking water standards for nitrate pollution and publicly available information suggests more could follow.
Last year, Canterbury saw its highest-ever number of dairy cattle, the primary source of nitrate pollution in the region. Furthermore the area under irrigation, also linked to increased nitrate pollution, has continued to increase. As nitrate levels rise, associated costs are climbing for Canterbury’s communities.
Environment Canterbury (ECan), the regulator responsible for protecting drinking water sources in this region, has said nitrate pollution will get worse before it gets better and is a “legacy issue”. However, drawing together information on cattle numbers, irrigation, current state of drinking water and trends not only demonstrates failure by ECan to protect drinking water from nitrate contamination but also suggests the regulator’s recent decisions are likely to be making the situation worse.
Already bad and getting worse
Some communities and households in Canterbury are already grappling with nitrate levels above the drinking water standards (the Maximum Allowable Value or MAV, 11.3mg/L as nitrate-nitrogen). 1,2 Publicly available information suggests the problem of drinking water supplies breaching national standards for nitrate in Canterbury could get significantly worse, meaning more communities face the same, with costs escalating.
Environment Canterbury (ECan) is the regional council responsible for controlling nitrate pollution and protecting sources of drinking water in the region. 2 Our analysis of water policy in place over at least the last decade (if not earlier), demonstrated that in many instances it would have been possible for ECan to use bylaws and planning, in a way that protected or reduced pollution of communities’ source water. 2 Failure to do so means the cost of treating nitrate polluted drinking water falls on those downstream – households on private supplies and ratepayers.
ECan has said nitrate pollution of groundwater will get worse before it gets better, due to the time it takes for nitrate to move through groundwater systems.3 It has described nitrate pollution as a ‘legacy issue’. 4 However, publicly available information suggests the Council’s very recent decisions are likely to be making the situation even worse.
Recent decisions contributing, not just a legacy issue
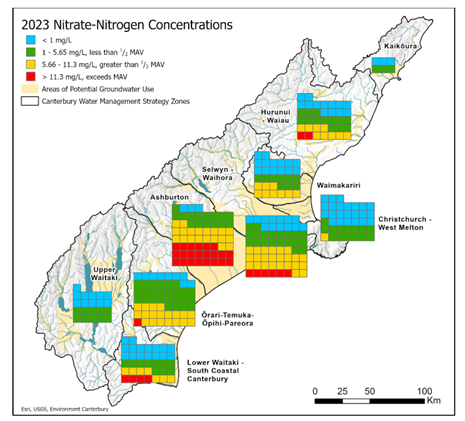
ECan has failed to protect many of the region’s drinking water sources from nitrate pollution. It has failed to meet its own 2020 drinking water targets in its Canterbury Water Management Strategy for drinking water quality. 5 The region’s latest groundwater report shows 59% of monitored groundwater sites have nitrate concentrations that are “likely” or “very likely” to be increasing. 6 Already, 10% of monitoring sites across the region breach the drinking water standard for nitrate (11.3 mg/L) (indicated in red, Figure 1). 6 For comparison, nitrate-nitrogen levels in unaffected NZ groundwater (no human influence) are estimated to have a median value between 0.3 and 1.0 mg/L. 7 Importantly, the MAV is a human health limit, not a limit that should be applied to the protection of groundwater. The impact of pollution at this level on environmental health is high and emerging evidence of human health risks at much lower levels suggests regulators must exercise more precaution to protect human health (more in Appendix). 2
Figure 1: Nitrate-nitrogen concentrations in potential drinking water from wells/bores sampled in a 2023 annual survey.
Each square represents a well/bore sampled in the survey. Source: Environment Canterbury, 2024
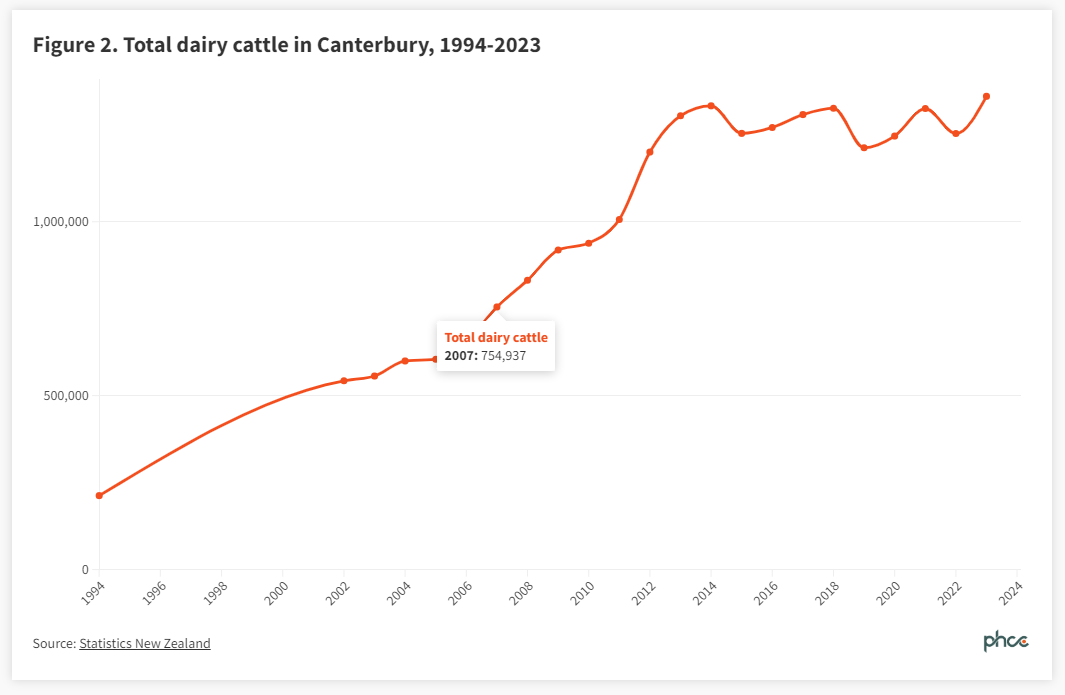
Despite these high levels of groundwater contamination, the number of dairy cattle in the region has continued to increase. As of June 2023, the number of dairy cattle in Canterbury is at the highest since records began (Figure 2). 8 The number of dairy cows in a catchment is the strongest predictor of nitrate concentrations in surface water (ie, rivers, streams, lakes, which are connected to and influence groundwater quality). 9 A recent survey of NZ’s ground and surface waters demonstrated that animal urine and urea-based fertilisers were commonly identified sources of nitrate pollution. 10 What is essential to know, but appears not to be publicly available, is how this increase in dairy cattle is distributed between catchments and, therefore, how it impacts specific drinking water sources.
Figure 2: Total dairy cattle in Canterbury, 1994 to 2023
Additionally, the area under irrigation has continued to increase, even in recent years. The most recent StatsNZ Agricultural Production Survey recording area under irrigation shows an increase from 478,100 hectares (ha) in 2017 to 479,900 ha in 2022.11 However, ECan’s own reports suggest an even larger increase—from 507,000 in 2017 to 546,205 ha in 2020. 12
The link between irrigation and nitrate pollution is well established. 13 It has also been documented that where the Council and commercial interests have aimed for ‘efficiency’ of water use, this has resulted in worse pollution of waterbodies as it has allowed for expansion of areas under irrigation. 14 Efficiency measures can obscure the extent of overall pollution or pressure on water bodies. 15
High costs for those downstream
Territorial authorities (district and city councils) do not have power to regulate land use and polluting activities. However, as suppliers, territorial authorities are responsible for the safety and treatment of water they supply. 2 Treatment costs are paid for by rates. Standard drinking water treatment does not remove nitrate and, where ECan has allowed nitrate levels to increase to unsafe levels, suppliers are now having to investigate either new sources or new treatment equipment. Both options are complicated and costly.
| Case Studies |
| Selwyn District Council has begun investigating an alternative drinking water source. The investigation alone is budgeted at just over $5 million and, should they find a suitable alternative, the council has estimated establishing the new source for their communities’ supplies could be ~$400 million. 16 |
| When one of Waimate District Council schemes servicing approximately 600 people breached the MAV, it was reported a denitrification unit for the scheme could cost an additional $500,000 to $750,000 plus ongoing operating costs. 17 |
Private supplies (eg, households on bore water) will have to source and pay for their own solutions. Anecdotally, where people on private supplies are concerned by the nitrate concentrations in their drinking water, they are either drinking (more expensive) bottled water or installing bench top denitrification units.
Regulatory failure increases health risks and transfers costs to public
Allowing drinking water contamination at the levels detected in Canterbury amounts to serious regulatory failure. Communities and households now face escalating costs as their once potable water breaches health standards.
Before there can be confidence that nitrate pollution will reduce, ECan must clearly demonstrate to its communities, and its district and city councils, that it is not continuing to add to the ‘legacy issue’ of nitrate pollution through decisions it is making now.
Central government also has an essential regulatory role in the protection of communities’ drinking water sources. We have highlighted in previous Briefings that the current Government should not weaken existing protection for drinking water sources,18 as well as stressed the greater role that Taumata Arowai, the national drinking water regulator, should take in source water protection.19
What is new in this Briefing
- Some Canterbury communities’ drinking water supplies are already breaching drinking water standards for nitrate, which poses risks to human health, and more are at risk of breaching the standard due to regulatory failure.
- ECan is responsible for controlling nitrate pollution and has the regulatory tools to protect sources of drinking water in the region (although the Government has indicated they may weaken these protections, see more detail in our previous Briefing17)
- A major driver of increasing nitrates is the intensification of livestock agriculture. Concerningly, dairy cattle reached their highest ever numbers in the region in 2023, with dairy cattle being the major source of nitrate pollution, and the area under irrigation has also increased in recent years.
- Treating drinking water to remove nitrate is costly and complicated, and along with the health risks, the treatment costs fall on the public not ECan or polluters.
Implications for public policy and practice
- Regulators, especially (but not only) regional councils, must give urgent attention to effective and affordable measures to protect drinking water and reduce nitrogen pollution where concentrations are high.
- Central government must not weaken existing source water protection measures and where necessary strengthen them.
- Given the health risks and costs falling on ratepayers, territorial authorities should demand strengthened protection of their drinking water sources from their regional councils.
Authors details
Marnie Prickett, Department of Public Health, University of Otago Wellington, and Public Health Communication Centre
Adam Canning, TropWATER, James Cook University’s Centre for Tropical Water and Aquatic Ecosystem Research
Tim Chambers, Associate Professor in the Ngāi Tahu Research Centre, University of Canterbury
Prof Michael Baker, Department of Public Health, University of Otago Wellington, and Public Health Communication Centre
Prof Simon Hales, Department of Public Health, University of Otago Wellington, and Public Health Communication Centre
Appendix
NZ’s current Maximum Allowable Value for nitrate is a human health limit aimed to protect infants under six months old from a condition called blue baby syndrome (methaemoglobinemia). However, emerging evidence suggests human health risks may occur at much lower nitrate concentrations.
The United States Environmental Protection Agency has initiated its first comprehensive review of the nitrate drinking water standard since its initial assessment in 1991.20 Likewise, The French Agency for Food, Environmental and Occupational Health and Safety recently concluded “in light of new epidemiological and toxicological data, the relevance of the quality limit of 11.3 mg/L of nitrates in drinking water” needs to be assessed. 21